
Stock Market Technical Analysis Basics: A Beginner’s Guide to Smarter Trading
Ever looked at a stock chart and wondered what all those lines and patterns meant? That’s the world of technical analysis—a powerful toolkit traders use to predict market movements. Whether you’re a beginner investor or a budding day trader, understanding Stock Market Technical Analysis Basics is a game-changer.

In this post, we’ll break down the concepts, tools, and strategies that form the backbone of technical analysis. We’ll go beyond the surface to offer unique insights and practical tips so you can approach the stock market with more confidence—and less guesswork.
What is Technical Analysis in the Stock Market?
At its core, technical analysis is the study of price movement and trading volume using historical market data. Unlike fundamental analysis—which looks at a company’s financials—technical analysis focuses purely on what the market is doing, not why it’s doing it.
Key Assumption: All known information (earnings, news, sentiment) is already reflected in the price. The only thing that matters now? How price behaves going forward.
Why Technical Analysis Matters: A Quick Comparison
| Feature | Technical Analysis | Fundamental Analysis |
|---|---|---|
| Focus | Price & Volume | Financials & Valuation |
| Time Horizon | Short to Medium Term | Long Term |
| Tools | Charts, Indicators | Balance Sheets, P/E Ratio |
| Best For | Traders & Swing Investors | Value Investors & Analysts |
| Decision Driver | Market Trends & Patterns | Business Health & Performance |
While fundamental analysis helps you find what to buy, technical analysis helps you decide when to buy or sell.
🔗 Related: Difference Between Technical and Fundamental Analysis – Investopedia
The Core Principles of Technical Analysis
To understand Stock Market Technical Analysis Basics, you need to grasp these three foundational principles:
1. Market Discounts Everything
This principle suggests that all public information is already priced into the stock. Instead of looking for new information, technical analysts look for how the market is reacting to known data.
2. Price Moves in Trends
Markets don’t move randomly—they tend to follow trends. These trends can be:
-
Uptrend: Higher highs and higher lows
-
Downtrend: Lower highs and lower lows
-
Sideways (Range-Bound): Little price movement
3. History Repeats Itself
Price patterns tend to repeat over time due to recurring human behavior, like fear and greed. Recognizing these patterns can help traders make informed decisions.
Must-Know Chart Types in Technical Analysis
Charts are the foundation of technical analysis. Here are the main types:
📊 Line Chart
-
Shows a stock’s closing prices over time.
-
Great for spotting long-term trends.
📈 Bar Chart
-
Shows opening, closing, high, and low prices.
-
Offers more detail than line charts.
🕯️ Candlestick Chart (Most Popular)
-
Visually intuitive with color-coded bars.
-
Easy to spot bullish and bearish trends.
💡 Try tools like TradingView for free access to live candlestick charts.
Key Indicators & Tools Every Beginner Should Know
1. Moving Averages in Stock Market Technical Analysis Basics
Smooth out price data to identify the trend.
-
Simple Moving Average (SMA): Basic average over a period.
-
Exponential Moving Average (EMA): Gives more weight to recent prices.
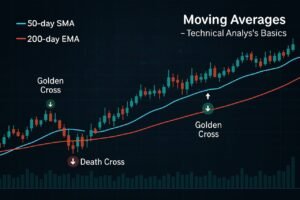
Tip: A 50-day and 200-day crossover is a classic bullish/bearish signal.
2. Relative Strength Index (RSI)
Measures the speed and change of price movements.
-
RSI > 70 = Overbought
-
RSI < 30 = Oversold
🔗 Learn more: RSI Explained – Investopedia
3. MACD as a Tool in Stock Technical Analysis
Shows trend strength and momentum.
-
Signal line crossovers = entry/exit points
-
Histogram = momentum shifts
4. Support and Resistance Levels
-
Support: Price floor where buyers emerge
-
Resistance: Price ceiling where sellers appear
5. Volume Trends in Stock Market Technical Analysis
Volume validates price moves. A price breakout with high volume is more reliable than one with low volume.
Chart Patterns to Master
Chart patterns are visual formations that signal future price movement. Here are the basics:
✅ Bullish Patterns
-
Cup and Handle
-
Ascending Triangle
-
Double Bottom
❌ Bearish Patterns
-
Head and Shoulders
-
Descending Triangle
-
Double Top
Understanding these patterns lets you anticipate breakouts and reversals with greater accuracy.
How I Applied These Basics in Real Life
When I first got into trading, I relied heavily on stock tips and news headlines. I’d panic-buy after a big earnings announcement or sell during a market dip—classic rookie moves.
Once I understood the basics of technical analysis, things changed:
-
I used RSI to avoid buying into overbought stocks.
-
I spotted a “cup and handle” in a small-cap tech stock and rode a 30% gain in two weeks.
-
By analyzing volume spikes, I learned to differentiate fake breakouts from real ones.
The point? You don’t need to be a market genius. You just need a consistent strategy grounded in price action.
Common Mistakes to Avoid in Technical Analysis
-
Overloading with Indicators: More isn’t better. Stick to 2-3 reliable tools.
-
Ignoring Volume: Always confirm patterns with volume.
-
Trading Against the Trend: “The trend is your friend” isn’t just a cliché—it’s wisdom.
-
No Stop Loss: Always define your risk before entering a trade.
Tools & Platforms to Practice Technical Analysis
| Tool | Best For | Free Version |
|---|---|---|
| TradingView | Charts & Community | ✅ |
| StockCharts | Indicator-heavy charts | ✅ |
| Investing.com | Global market data | ✅ |
| ThinkorSwim by TD Ameritrade | Advanced backtesting | ✅ |
Try paper trading first to hone your skills without risking real money.
Final Thoughts: Why Stock Market Technical Analysis Basics Matter
Learning Stock Market Technical Analysis Basics isn’t just about predicting the market—it’s about gaining control.
You won’t win every trade, and that’s okay. But with the right tools, mindset, and discipline, you’ll be making decisions based on strategy—not emotion.

Whether you’re swing trading, day trading, or just timing your long-term entries better, technical analysis offers a measurable edge.
📣 What’s Next? Take Action!
-
💬 Got a favorite technical indicator? Share it in the comments below.
-
🔍 Explore more: Read our guide on Freelancing vs Job in 2025 | Key Differences, Pros & Cons
-
📰 Subscribe to our newsletter for weekly trading strategies and insights!